Azure · Observability · Monitoring
Observability for B2B integrations on Azure (logs, metrics, alerts)
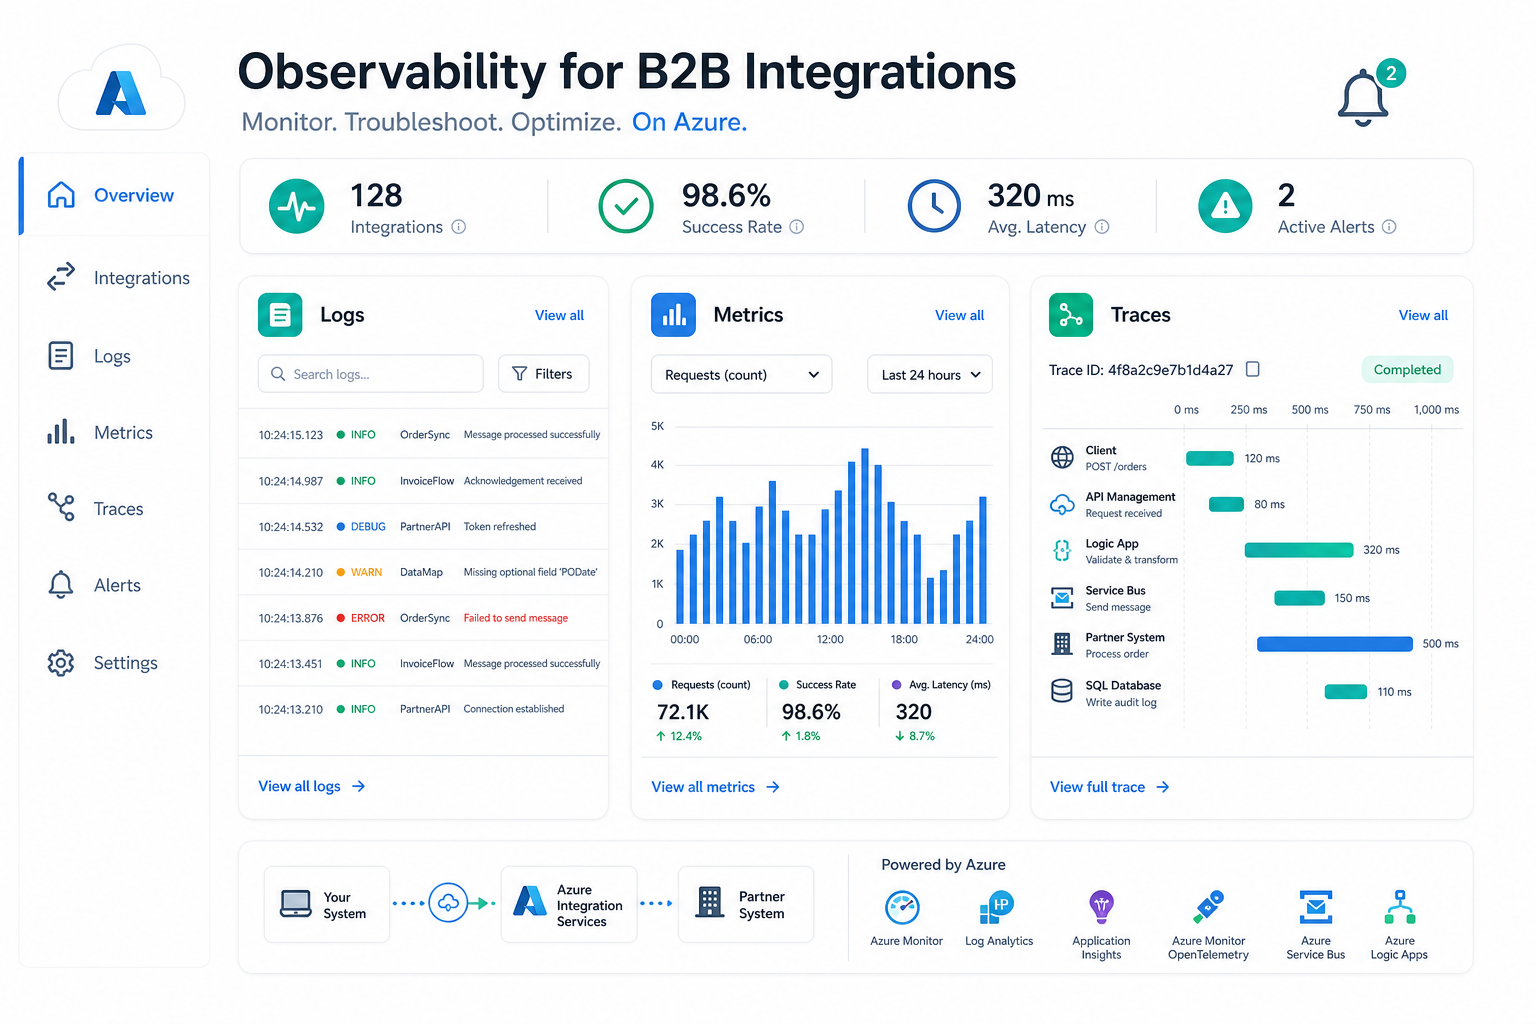
B2B integrations live between different systems and fail in silent ways: an order not imported, a price not updated, a payout not reconciled. Without observability you notice problems too late. Let's see how to make them transparent on Microsoft Azure.
The three pillars
| Pillar | Purpose |
|---|---|
| Logs | What happened, in detail, for each operation |
| Metrics | How much and how often: volumes, latencies, errors |
| Traces | The path of a request across components |
Structured logs and correlation IDs
Useful logs are not free-form sentences but structured events with consistent fields (operation, outcome, duration, channel, identifiers). The key piece is the correlation ID: an identifier that follows an operation from entry through all downstream steps, so you can reconstruct the entire journey of a single order across queues and workers.
Technical and business metrics
Beyond technical metrics (latency, error rate, queue depth) you need business metrics: orders imported per hour, products synced, payouts reconciled, percentage of feed disapprovals. These are what tell you whether the system is actually doing its job.
Application Insights and distributed tracing
On Azure, Application Insights collects logs, metrics and traces and automatically correlates calls across Functions, queues and external dependencies. Distributed tracing shows the end-to-end path of a request, making it obvious where time is lost or a step fails.
Useful, not noisy, alerts
An alert is valuable only if it is actionable. Alert on concrete symptoms:
- abnormal growth of the dead-letter queue;
- error rate over threshold on a marketplace API;
- no orders imported in a window where some should arrive;
- payout reconciliation differences above a threshold.
Too many alerts breed alert fatigue: prefer a few meaningful signals.
Operational dashboards
A good dashboard answers a simple question: "is the flow working?". It shows recent volumes, errors, latencies and queue status, so a glance is enough to gauge system health.
Common mistakes
- unstructured logs that cannot be queried;
- no correlation ID to follow an operation;
- technical metrics only, no business metrics;
- too many or too generic alerts, therefore ignored.
Conclusion
Observability is not a luxury: it is what lets you operate B2B integrations with confidence. Structured logs with correlation IDs, technical and business metrics, distributed tracing and actionable alerts — with Application Insights on Azure — make the invisible visible. Reference: Application Insights (Microsoft Learn).